Network Visibility, Event Monitoring and Alerting with Prometheus on A10 Thunder

Networks today are becoming increasingly complex. Enterprises are migrating their workloads to the cloud as they embrace a hybrid strategy. They have hundreds, if not thousands, of employees who bring various devices into the network that enable productivity and communications. Enterprise networks are constantly being re-engineered to handle these challenges. Service providers are also going through major network overhauls as they gear for the onslaught of IoT devices that will come along as 5G becomes more pervasive.
These technical evolutions and the challenges they present are a constant in the life of network operations teams who carry the burden of ensuring that the network is performing at its optimal best. To do this, they must maintain operational insights into the performance, health and security of each and every device in their network. It is these very application insights that enable the continuous optimization of network performance to match not just current, but future usage patterns. Thus, it is not surprising that network visibility, security and application insights, event monitoring and alerting are critical to the success of enterprises and CSPs alike.
Network Visibility and Operational Insights into A10 Devices
A10 Networks provides a host of networking solutions, all of them designed to make sure network applications run as smoothly as possible. These include Thunder® CFW, Thunder CGN, Thunder ADC and Thunder TPS. Regardless of where the solutions sit in a network or the functions they provide, it is important to have visibility and analytics into how these devices are performing. A10 enables this by making a vast array of statistics and metrics available through APIs and GUIs, as well as CLI. These metrics can be tracked at the individual device level, or in an aggregated fashion using A10 Harmony® Controller or aGalaxy central management platforms. Not only do these solutions offer central visibility for A10 devices, they also provide central management for them as well.
A10 has recently integrated Prometheus capabilities into its management toolkit to broaden user visibility into all devices on the network, including A10 devices, and provide security and application insights over time. A10’s latest operating system, ACOS 5.0, supports Prometheus natively.
What is Prometheus?
Prometheus is an open-source time-series database that was released in 2015. It is managed by the Project of Cloud Native Computing Foundation that also manages K8s and Envoy.
Prometheus uses the HTTP PULL model to scrape data from network devices and store the collected values in a time-series database. Once this data is in Prometheus, it can be tracked over time to understand various baselines and thresholds that the networks should be operating under, thus enabling event monitoring and alerting. Since it is open source in nature, Prometheus has become a popular choice among admins in the networking industry.
Alerting: Prometheus offers integrations into ITSM systems, which makes network management even more hands-off. One can create fancy if-this-then-that rules which, when triggered, can send notifications via communication tools like mail, SMS, Slack, PagerDuty, etc.
Network Visibility and Analytics: Prometheus integrates seamlessly with tools like Grafana. Grafana is an open-source visibility tool that was released in 2014. It has native support for using Prometheus as a data source that enables an end user to create custom panels that include graphs and charts – powered by using interactive query builders including Prometheus Query Language (PromQL). These panels come together to form complex monitoring dashboards that surface various data from different devices all on a single pane of glass.
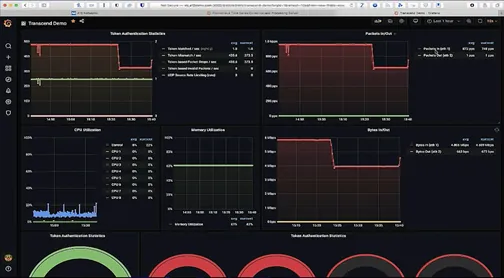
Figure 1. Example of a custom dashboard created in the open-source tool, Grafana, providing application insights into an A10 device
The Importance of a Time-series Database
Chances are that a network operator wants to track statistics not just from A10 devices, but from all other devices in his/her network. Exporting network device statistics to a time-series database can be a very beneficial exercise and provide deeper application insights into the ongoing performance of all devices within the network. It is indeed useful to have real-time statistics for all devices in a network available, but they become even more powerful resources when they are tracked over time. Imagine a single statistic/counter plotted against the x-axis of time. With access to such a database, one would be able to study how the counter behaves not just over the course of the last hour, day or week, but over the course of months, quarters and even years. Such a database is known as a time-series database.
This is where Prometheus comes into the picture.
For the network admin, this centralized network visibility, application insights and monitoring using Prometheus provides increased assurance that the network is running as needed and greater flexibility to use network techs for overall monitoring even though their skill sets may be more specialized.
It is not surprisingly then that open-source Prometheus has gained a lot of traction over the last few years and is used by some big names in the industry such as Pandora, Digital Ocean, DreamHack and Shuttle Cloud.
Integration with A10 Devices
A10’s ACOS 5.0 operating system supports Prometheus natively. This means that Prometheus can directly send HTTP PULL scraping requests to the A10 device and receive the requested statistics including system status, network statistics and secure application service insights. As discussed earlier, this data can then be provided to Grafana or ITSM systems for visibility and automated alerts.
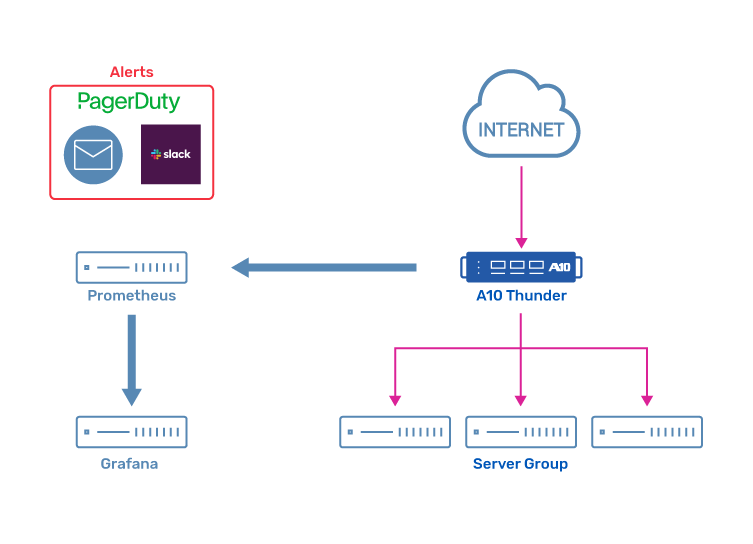
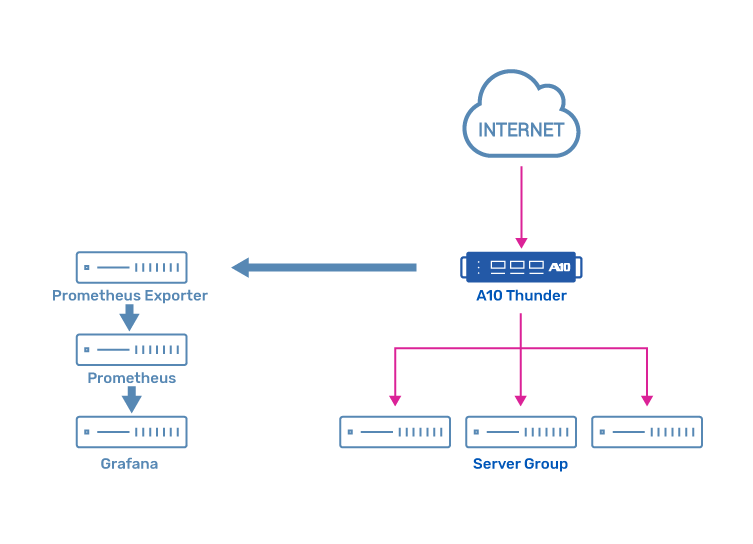
Figure 2. Prometheus integration with A10 devices. A) Native Prometheus integration with an A10 device running ACOS 5.x B) Integration with an A10 device running ACOS 3.x/4.x enabled with the use of Prometheus Exporter.
A10 devices running an older operating system (ACOS 3.x, ACOS 4.x) can also integrate with Prometheus. The only change in topology is the addition of a Prometheus Exporter, a python-based script that acts as a proxy between Prometheus and ACOS (see topology). The Prometheus Exporter python script is maintained on the A10 Networks GitHub page.
State of the Art Centralized Management and Visibility Expanded with Prometheus
Even though A10 provides state-of-the-art central management and visibility solutions, the use of an open-source tool like Prometheus can be a useful add-on that lets you see data, not just for A10 devices, but across all other devices in your network. Having a central database of these statistics lets you use Prometheus integrations with Grafana and ITSM systems to have central, automated operational insights into all your network devices. This ensures round-the-clock awareness of the performance, health, and security of the network. With data tracked over the course of months, quarters and even years, it powers the knowledge of various characteristics of a network.
Administrators can track service usage, seasonality in business and network operations, and the headroom that current devices in the network provide. The ability to correctly forecast the future needs of your network will also dramatically improve.
More Information
- Read technical article: Application Network Visibility using the Prometheus and A10 Thunder
- Read technical article: Monitor Application & Network using ACOS Prometheus Exporter