Proactive Application Management Starts with Actionable Performance Analytics

You need to understand how your applications are performing. You need to understand their state of security.
Is there network latency? Are there too many users at once bogging down your servers? Is user experience degrading over time? Are there any security issues?
Traditionally, application delivery controllers (ADCs) give you basic statistics such as connection counts, but not much else. And you’re limited in your visibility. ADCs typically lack visibility per application, per URL and per request.
With today’s launch of the A10 Harmony Controller, which bridges data center and multi-cloud environments, A10 takes application performance and security analytics to the next level. The Harmony application delivery and security controller gives users granular insight into application performance and security anomalies. You can view performance and security metrics based on application, URL and request.
This fine-grained visibility empowers you to make more informed decisions regarding application security and performance, which improves the customer experience, leads to swifter ROI and can improve revenue.
The A10 Harmony Controller delivers visibility across all of your clouds and data centers. And it offers analytics across ADC form-factors and types, such as A10 Thunder ADC, A10 Lightning Application Delivery Service (ADS) and HAProxy open source load balancers.
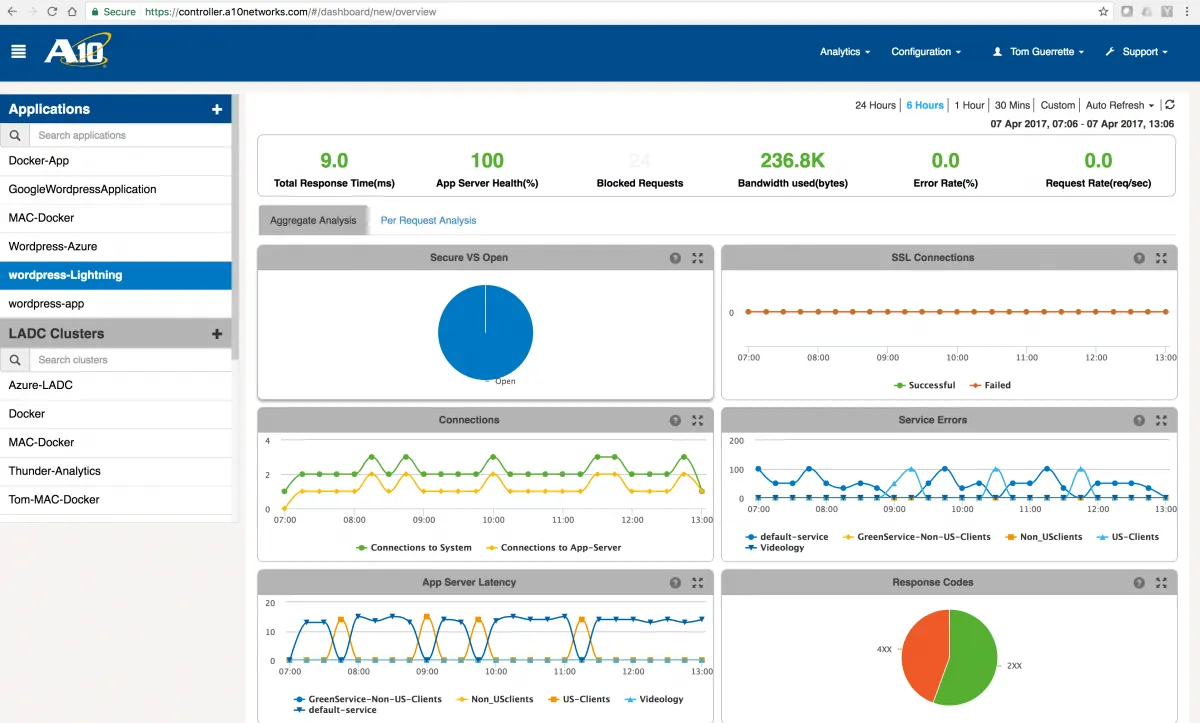
Harmony offers application performance monitoring-style analytics that are useful to both the line of business users and application development and DevOps teams through a single, customizable portal.
For example, you can customize the dashboard to show end-to-end client response time; latency on an application, load balancer and user level to determine where the latency is coming from; response codes that allow you to drill down into whether a particular server is giving 404 errors while another is not; top pages and servers; geographical request distribution; total bytes exchanged; and additional stats and data of customer usage and applications.
The analytics capabilities of the Harmony Controller provide insight into performance and security indicators and can send alerts based on certain thresholds. If end-to-end response time slows, administrators can receive an alert before it becomes noticeable to end users. This empowers administrators to make proactive changes before customer experience suffers.
Additionally, the ability to automate allows you to auto-scale and add instances based on performance thresholds. For example, you can add Lightning ADC instances automatically if traffic exceeds your set threshold to ensure no degradation in user experience.
And for DevOps and app development teams, the Harmony Controller showcases data that can inform their development and deployment decisions and give them an understanding of how their applications perform in both testing and production scenarios.
With the Harmony Controller, you get centralized visibility and analytics for any underlying infrastructure, and you receive advanced per-application analytics whether your apps are located in on-premise environments, in public clouds or private clouds, or in any hybrid cloud combination.
With the A10 Harmony Controller, you’re in command and can make informed, proactive decisions about the performance and security of your application environment.
Find out for yourself how the A10 Harmony Controller delivers real -time, per-app visiblity and analytics to help you identify performance and security trends and make smarter decisions. Sign up for a free 30-day trial of A10 Harmony Controller now.
Seeing is believing.
Schedule a live demo today.