Challenges with Application Visibility

 After I create a web application and make it generally available to people for use, the first challenge I encounter is to finding the number of servers that need to be deployed to sustain the incoming traffic.
To determine the number of servers, I need to know the volume of traffic that will landing on them. Knowing aggregated numbers does not help here because the traffic does not come at a constant and consistent rate. Understanding the traffic pattern is imperative.
To start, I need to provision servers based on the maximum load, unless I have a solution that automatically scales my servers based on traffic.
Once I make sure that all traffic is being handled properly, I can start worrying about the user experience. First experience, I must determine how long users for a page to load after clicking. To figure this out, I split it into two parts: server response time and browser redner time.
Once everything looks good, it’s time to drill down deeper and figure out what areas (URLs) of the applications are being used more than others. Typically, these are the critical parts of the application workflow and require special attention for availability and response time. When I see that traffic to a certain URL is very high, I consider dedicating servers for that traffic and try to optimize that code path.
When high priority infrastructure items are taken care of, I like to know more about users. I look into how many users are visiting, wither they’re new or returning and how frequently the return. I also examine how many pages the view and the order in which they visit pages. Then, I account for which browsers and devices they use, where they come in from and their geographical distribution.
Next I figure out how much of the traffic is coming from non-useful bots so I can block that traffic and focus on the real traffic. I would also like to detect (as well as prevent) malicious traffic sent by an attacker. The malicious intent may include a distributed denial of service (DDoS) attack, an attempt to steal data or just an attempt to impact the user interface.
When I come up with new version of my application, I like to compare its performance to the version currently running. I only move the new version to production if its performance is acceptable.
Giving high level visibility into these areas is not always enough. When something goes wrong, the tool that provides application visibility should also help me debugging the issue and allow me to drill down into the individual request level.
Google Analytics is generally known to provide adequate application visibility data. However, that does not satisfy the need because:
- Google Analytics only captures the traffic through which the HTML page is accessed. All of my ajax calls and requests to other resources are not included
- Google Analytics gets triggers only when JavaScript is executed on the page. Bots access is not included
So what I see in Google Analytics is the subset of the traffic hitting my servers. When reports say the bot traffic amounts to more than 30 percent, I can’t accurately plan based on Google Analytics number. Also, because Google Analytics is a client side JavaScript tool it has no understanding of my deployment infrastructure and does not help me drill down into issues or help me scale.
A traffic load balancer is inline and can provide some insight, but load balancers like AWS ELB, NGINX or HAproxy provide very limited visibility into traffic and are not really helpful from an analytics point of view.
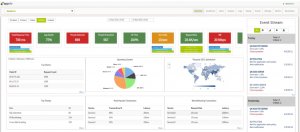
The good news is that I have a solution that not only provides visibility into my application traffic and helps me nail down issues, but one that also helps me take corrective actions. A10 Networks Lightning ADC offers continuous traffic insights along with advance load balancing and content switching; security (web application firewall and protection against traffic surges, DDoS attacks and bad bots); content optimization and acceleration; and seamless traffic steering in a continuous deployment scenario.
Free 30-Day Trial
Explore how true cloud-native architecture works in your environment via the A10 Lightning Application Delivery Controller (ADC) trial.
Seeing is believing.
Schedule a live demo today.